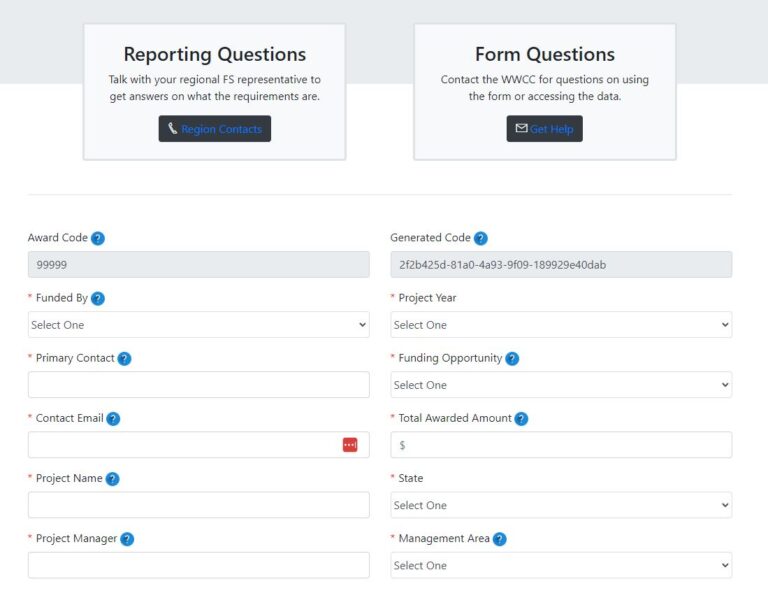
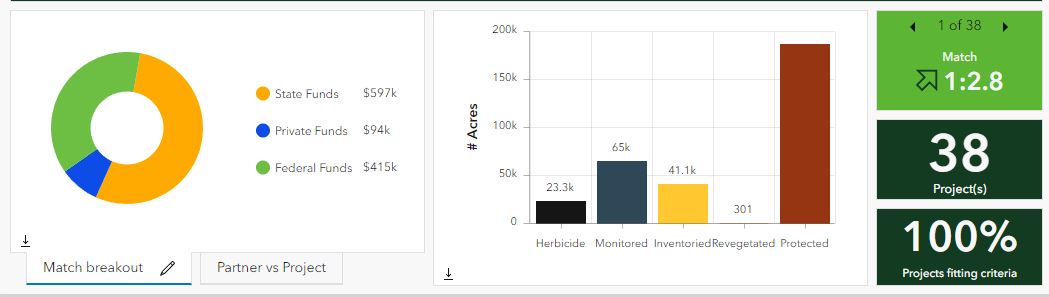
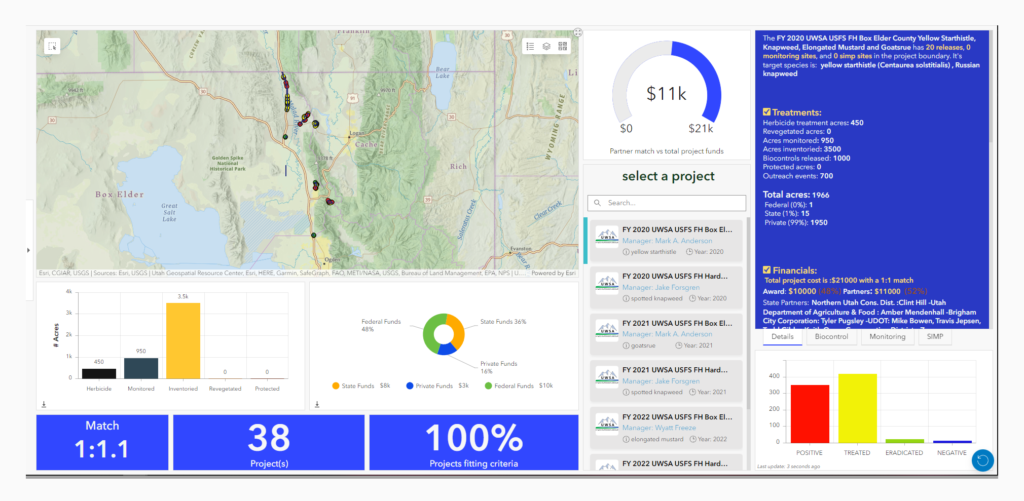
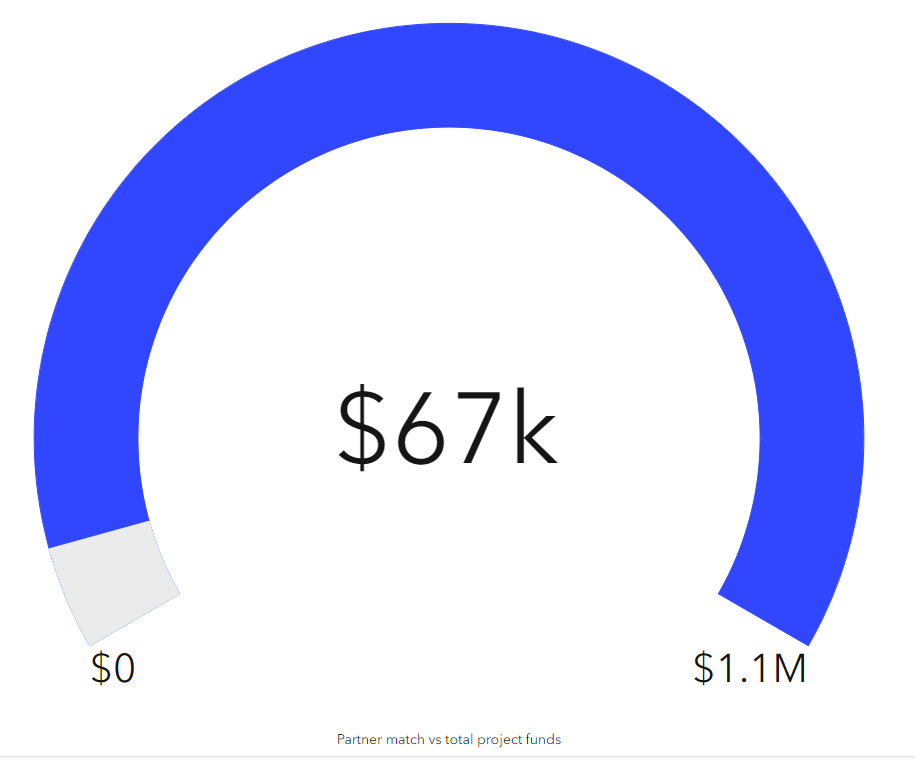
Easy Reporting for Invasive Species Projects

View, edit, display and report your project data with confidence.


    Easy Reporting

    Simple and efficient way of reporting to present information transparently to all stakeholders, regardless of technical knowledge.
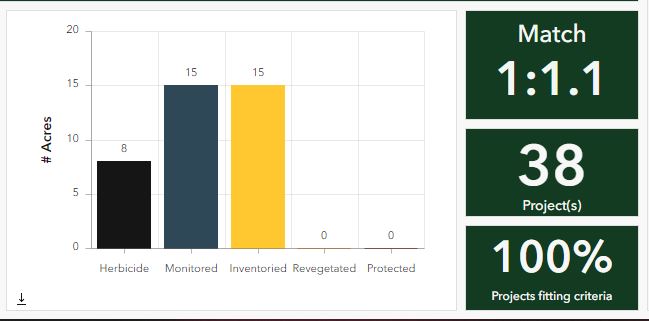
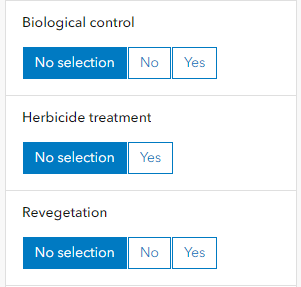
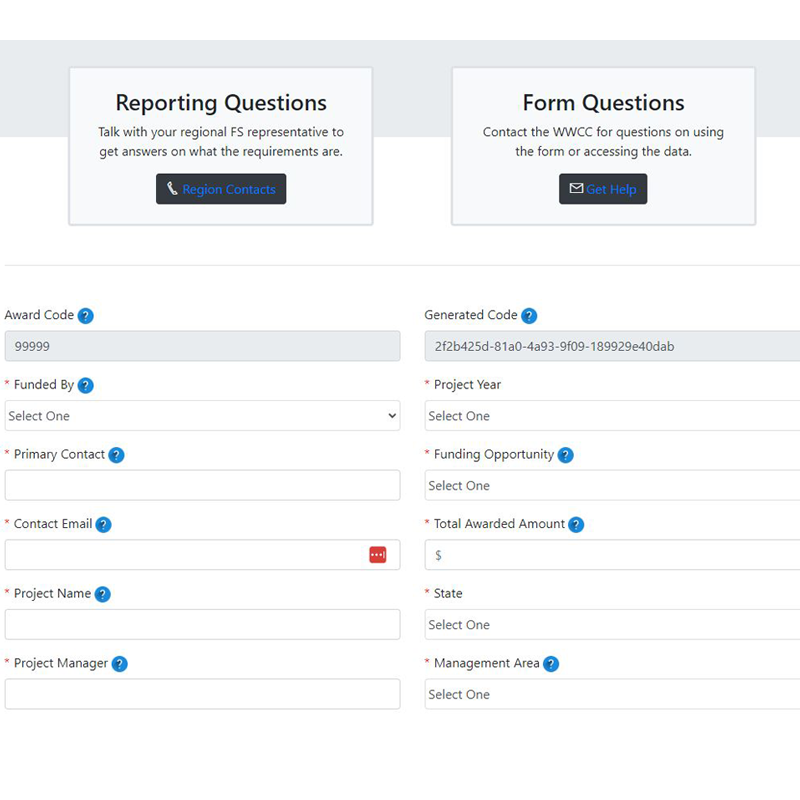
    Project Tracking

    Say goodbye to tedious manual updates and endless paperwork and say hello to a smarter, more efficient way of working.
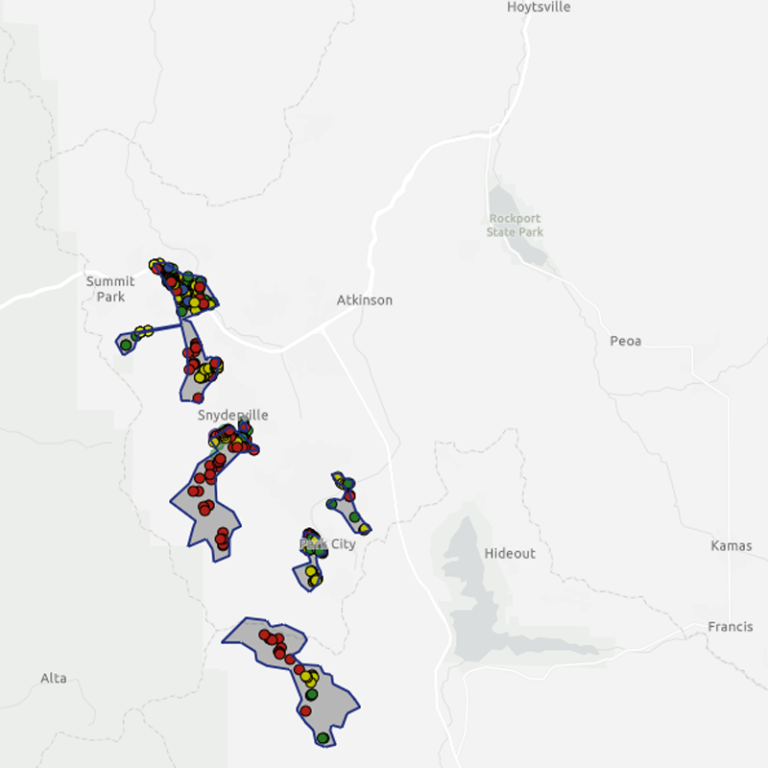
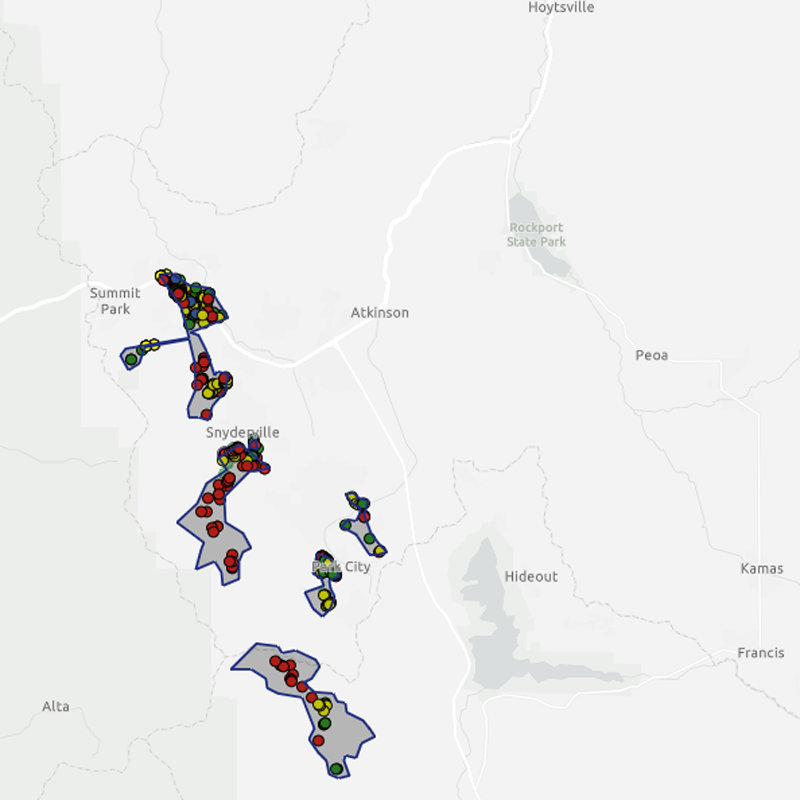
    Visualize Projects

    Gain a better perspective of the spatial dimensions of the project and aide communication about how the project will impact the area.
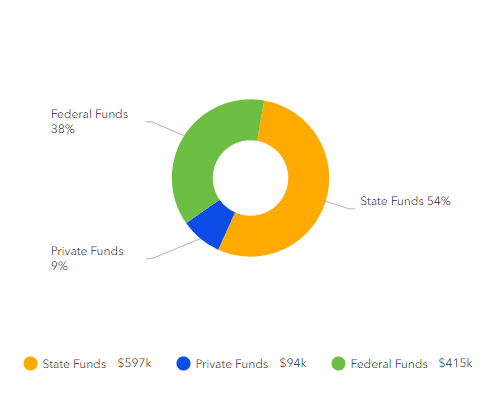
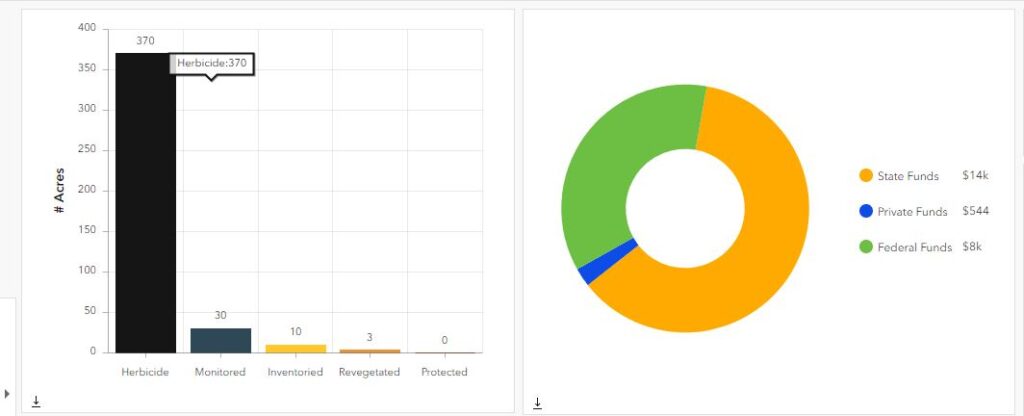
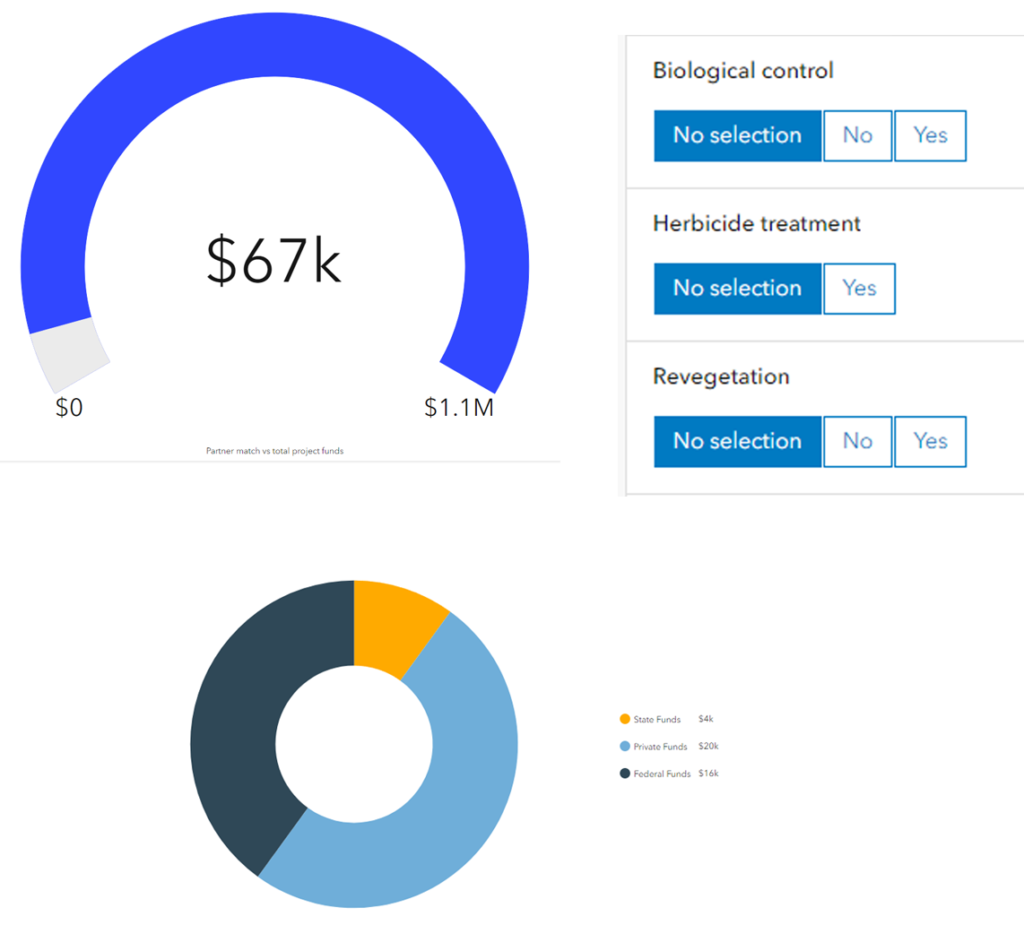
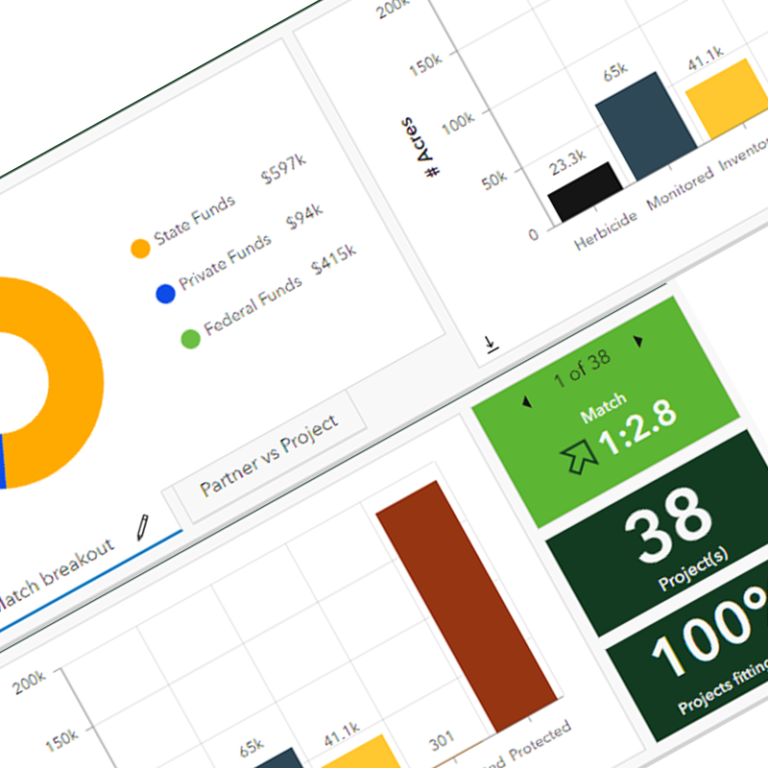
    Integrated tools for projects

    Transform your project reporting with this all-in-one solution for advanced calculations, optimized workflows and data-driven insights.

    Track Partner Match Dollars

    Get a current snapshot view of your total award and match contributions. Results can be displayed in multiple formats. 

    See The Breakouts

    Stay up to date on federal, private and state percentages.

    Integrated Charts and Graphs

    Track the things that matter. From treatments to funding, we can configure it all. 

    Form Entry

    Use the web based forms to enter in GIS project data. 

    K+

    Project acres

    states

    %

    Increased efficiency

    M

    Cost share funds

    Track state and federal projects

    Use an integrated form to input your state and federal project data.  Draw your project boundaries and attach reports, images, and stats. It’s web based and easy to use.

    Project management tools you need

    See calculated acres, biocontrol points, weed infestations, project match numbers, and final reports. All in one application view.

    Customized views

    Customize the view by only tracking the project data you need. We can build you a unique solution.

    Advanced features for detailed reporting

    Integrated storymaps, project reports, survey 123 data collection forms, spatial caclulations, and esri map services. All in an easy to use dashboard.

    Up to date federal BIL reporting

    For project managers needing an easy way to report on federal and state project funding, our interface makes that possible. 

    Track project match, partners contributions, on the ground activities, and outreach efforts.

    Stay compliant effortlessly.

    Customize your own solution

    Most Common Questions

    Here is the list of the most commonly asked questions. If you need additional help just ask.  

    Q. How long does it take to get a dashboard developed?

    Generally speaking, if you have your content gathered, we can have your dashboard done in 6-8 weeks.

    Can I get more than one dashboard developed at the same time?

    Yes, we can be working on several dashboards for you simultaneously.

    Do I need my data in EDDMapS?

    Yes. If you want to see your invasive data and/or biocontrol data then you must get your data entered into EDDMapS. It's free and easy to sign up and to get started.

    Where do I look for my state GIS layers?

    Start with your local county and/or state GIS department. Most agencies have central repositories that will contain all of the needed layers and map services.

    Can I customize my dashboard?

    Yes, we will work closely with you to get the exact look you are going for. We can customize any/all the widgets in the dashboard.

    How much does it cost?

    Use our integrated price quote form to get an idea of what a customizable build will cost.